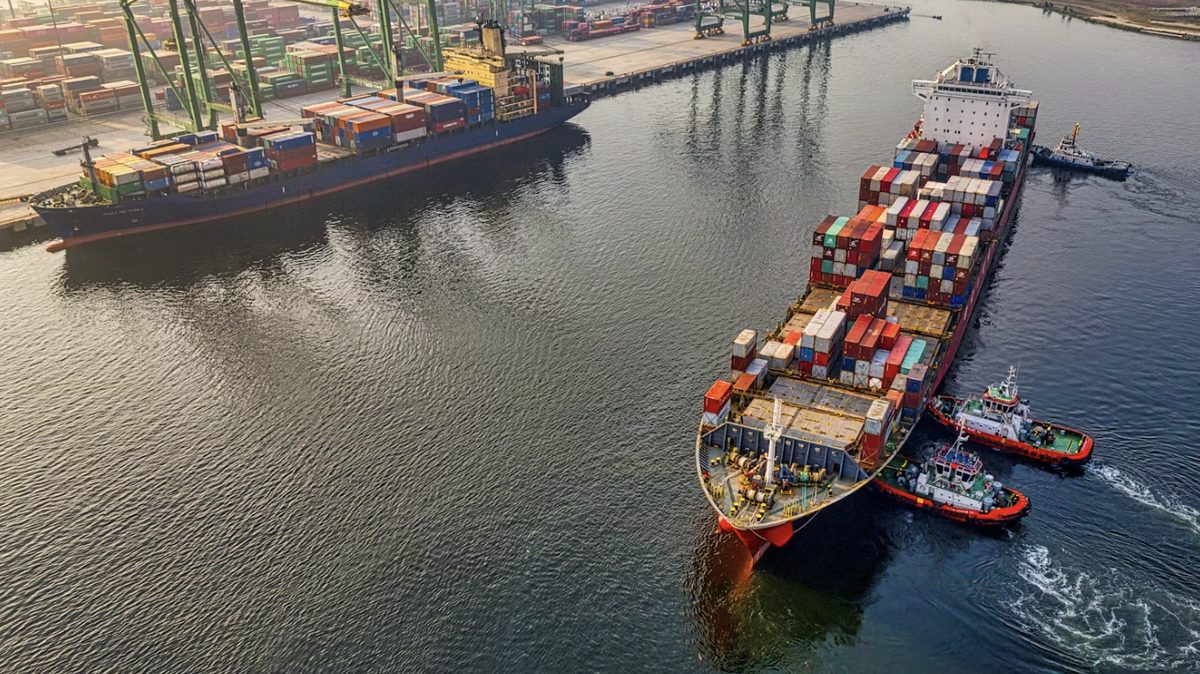
Shipping Lines Calling Townsville (NQ)
| Shipping Line | Service | Freq | Transit to Asia | NQ Call | Notes |
|---|---|---|---|---|---|
| MSC | Feeder via Brisbane | Weekly | 14–18 days | TVL → BNE → Asia | Largest global line; feeder via Townsville container terminal (NSS) |
| Maersk | Gemini Cooperation (w/ Hapag) | Weekly | 14–18 days | TVL → BNE → Asia | Gemini launched Feb 2025; improved schedule reliability |
| ANL / CMA CGM | Kimberley/Pacific service | Fortnightly | 16–21 days | Direct call some rotations | ANL is CMA CGM's AU brand; key NQ player |
| PIL (Pacific Intl Lines) | NQ–Asia via Singapore | Fortnightly | 18–22 days | Townsville direct call | Key NQ feeder line; Singapore hub transhipment |
| Swire Shipping | PNG/Pacific service | Fortnightly | N/A (Pacific) | Townsville direct call | Pacific Islands and PNG specialist; breakbulk capable |
FCL / LCL Rate Benchmarks — Asia to Australia
Townsville Free Time & Storage — NSS Container Terminal (Source: POTL Berths & Capability)
FCL Free Time
LCL Free Time
Container Release Workflow — Townsville Import
KPIs — Townsville Container Operations
THC (Terminal Handling)
Stack Charges
Feeder Premium
Maersk and Hapag-Lloyd launched the Gemini Cooperation in February 2025 replacing the 2M alliance. Target: 90%+ schedule reliability on Asia–AU. Townsville feeder connections via Brisbane expected more consistent. Monitor ANL/PIL for competitive response on NQ direct calls.
Top 20 HS Codes for NQ Imports — With Duty Rates
| HS Code | Description | MFN Duty | FTA (ChAFTA) | DAFF Risk |
|---|---|---|---|---|
| 2710 | Petroleum oils and preparations | 0% | 0% | Low |
| 8703 | Motor cars and vehicles | 5% | 0% | Medium (AQIS) |
| 8708 | Motor vehicle parts & accessories | 5% | 0% | Low |
| 3102 | Mineral/chemical fertilisers (nitrogen) | 0% | 0% | HIGH (IMDG DG) |
| 3105 | Mixed fertilisers (N-P-K compounds) | 0% | 0% | HIGH (IMDG) |
| 7208 | Flat-rolled steel products | 5% | 0% | Medium (AD measures) |
| 8471 | Automatic data processing machines | 0% | 0% | Low |
| 8544 | Insulated wire, cable & conductors | 0–5% | 0% | Low |
| 8413 | Pumps for liquids | 0–5% | 0% | Low |
| 7304 | Steel tubes and pipes | 5% | 0% | Medium (AD) |
| 2804 | Industrial gases (hydrogen, oxygen) | 0% | 0% | HIGH (DG Class 2) |
| 8431 | Mining machinery parts | 0–5% | 0% | Medium |
| 0201 | Meat of bovine animals (fresh) | 0% | 0% | VERY HIGH (biosecurity) |
| 2007 | Jams, jellies, purees (food) | 5% | 0% | HIGH (DAFF food) |
| 8501 | Electric motors and generators | 0% | 0% | Low |
| 3824 | Chemical preparations (industrial) | 0–5% | 0% | HIGH (MSDS required) |
| 9403 | Furniture and parts | 5% | 0% | Medium (timber biosecurity) |
| 6403 | Footwear with leather uppers | 10% | 0% | Low |
| 8525 | Transmission apparatus | 0% | 0% | Low |
| 6204 | Women's clothing / apparel | 10% | 0% | Low |
FTA Duty Savings — NQ Importer Intelligence
| FTA | Key Commodity Categories | Duty Reduction | CoO Form | NQ Relevance |
|---|---|---|---|---|
| ChAFTA (China) | Steel, machinery, electronics, clothing | Most goods 0% (from 5–10%) | Form A or origin declaration | Very High — NQ imports significant China origin |
| JAEPA (Japan) | Vehicles, machinery, electrical | 5% → 0% on most goods | Exporter self-cert | High — mining equipment from Japan |
| KAFTA (Korea) | Steel, vehicles, electronics | Essentially 0% on goods | Form AK | Medium — some steel imports |
| AUSFTA (USA) | Industrial goods, chemicals | Most 0% | Exporter declaration | Medium — industrial imports |
| AIFTA (ASEAN) | Manufactured goods, agricultural | Substantial reductions | Form AANZ | High — SE Asia origin goods |
Import Declaration (FID) Accuracy Checklist — 15 Points
Pre-lodgement checks
Documentation checks
Steel flat products: AD and countervailing duties on certain steel from China, Korea, Malaysia. Uncoated copy paper: AD duties from various origins. Solar panels: AD investigation ongoing (China origin). Always check the Anti-Dumping Commission (ADC) online register before lodging FID for these categories.
Port of Townsville — Live Vessel Schedule
Access the official live schedule below — updated continuously by POTL.
POTL Pilotage & Marine Requirements
Compulsory Pilotage
Towage Requirement
AMSA Pre-Arrival Notification Requirements
| Notice | Timeframe | System | Key Information Required |
|---|---|---|---|
| Advance Notice | 96 hours before arrival | AMSA AIMS | Vessel details, voyage, crew, cargo manifest, DG pre-declaration |
| Updated ETA | 48 hours before arrival | AMSA AIMS / POTL | Updated ETA, any changes to cargo/crew |
| Final ETA + Berth | 24 hours before arrival | POTL PortConnect | Confirmed berth, pilot request, tug request, DAFF PABR submitted |
| Arrival Report | 4 hours / upon arrival | ABF ICS | Inward Cargo Manifest, crew list, stores declaration, ballast water |
| Dangerous Goods | 24 hours prior to port entry | AMSA MO42 | IMDG class, UN number, quantity, emergency contact, MSDS |
Anchorage — Cleveland Bay
Berth Booking — PortConnect
Townsville port call disbursement account for a typical 180m general cargo vessel: AUD $35,000–$75,000 (includes pilotage, towage, port dues, wharfage, agency fee, launch hire, crew services). Bulk mineral vessel call (Handysize): AUD $50,000–$120,000. All figures approximate — obtain formal proforma D/A from agent.
Terminal Operators — Port of Townsville (Source: POTL Port Service Providers · Berths & Capability)
| Operator | Berths | Cargo Type | Notes |
|---|---|---|---|
| NSS (Northern Stevedoring Services) | Berths 2, 3 + intermodal hub | Bulk minerals (Cu, Zn, Pb concentrate); containers & intermodal | Largest operator; shareholders Qube & Glencore. Expanded container/intermodal hub 2024–25. Source: nsspl.com.au |
| Townsville Marine Logistics (TML) | Multipurpose berths | Containers, breakbulk, bulk products | 24/7 operations. Source: POTL / TML |
| QSCT | Berth 4 | Raw sugar (bulk) | Seasonal Jun–Dec. Source: POTL Dry Bulk |
| POTL Operations | Berths 1, 7–8 + cruise/defence | Liquid bulk (petroleum), livestock, cruise, defence | Port authority manages multipurpose and specialist berths. Refer POTL Berths & Capability for current layout |
Waterfront IR Landscape — Townsville
MUA Coverage
Penalty Rates
Productivity Benchmarks — Container Operations
Townsville MPH
National Average MPH
NSS Bulk Rate
Under Hague-Visby Rules (Carriage of Goods by Sea Act 1991): (1) Note protest on Mate's Receipt if damage visible at loading. (2) Written notice to carrier within 3 days of delivery (latent damage). (3) Formal claim within 12 months of delivery. P&I Clubs: Standard Club, UK P&I, Gard. For IMDG cargo claims: insure all-risks; retain MSDS at all times.
POTL Governance & Structure
Ownership
Landlord Model
Channel Upgrade Project — Master Plan 2050
POTL's major capital project deepens and widens the Townsville harbour channel to accommodate larger Panamax vessels. The Channel Upgrade (completed 2024–25) widened the shipping channel to 180m at the inshore end, enabling significantly larger vessels to safely access the Port. GBR Marine Park Act approvals add significant lead time. Project has bipartisan Queensland Government support.
POTL Port Pricing Schedule 2025–26 (Key Rates)
| Charge | Unit | Rate (AUD) | Notes |
|---|---|---|---|
| Wharfage — containers | Per TEU | ~$56–$72 | Varies by import/export, full/empty |
| Wharfage — bulk minerals | Per freight tonne | ~$1.20–$2.50 | Commodity and berth dependent |
| Wharfage — liquid bulk | Per kilolitre | ~$0.45–$0.80 | Petroleum products (Berth 1) |
| Port dues (vessel) | Per GT per call | ~$0.32–$0.65 | Vessel size brackets; POTL tariff schedule |
| Pilotage | Per movement | ~$1,200–$4,500 | MSQ regulated; vessel LOA dependent |
| Towage (Smit) | Per movement | ~$3,500–$12,000 | Vessel size, number of tugs, time of day |
| Channel maintenance levy | Per GT | ~$0.05–$0.12 | POTL dredging cost recovery |
All operations within the Great Barrier Reef World Heritage Area face heightened environmental scrutiny. Spill response plan mandatory. Dust management at Berths 2/3. Ballast water: IMO D-2 standard. Antifouling paint restrictions. POTL EMS certified ISO 14001. ABF and DAFF conduct joint boardings for high-risk vessels.
Regulator Priority Focus — FY2025–26
| Regulator | Current Priority Focus | NQ Impact | Key Risk for Operators |
|---|---|---|---|
| AMSA | PSC: MLC 2006 crew welfare; MARPOL oil records; SOLAS fire safety | Townsville enhanced inspection port | Vessel detention; USD 15K–50K/day |
| ABF | Integrated Cargo System (ICS) reporting accuracy; anti-dumping compliance; prohibited imports | All NQ importers and cargo reporters | Cargo holds; penalties up to AUD 1M |
| DAFF | GBR enhanced biosecurity; new plant product conditions; live animal welfare | Very high — Townsville in GBR proximity zone | Cargo destruction; import prohibition; AUD 2.1M penalty |
| ACCC | Freight market monitoring; container shipping code compliance; terminal access | Container pricing scrutiny affects NQ freight costs | Misuse of market power; AUD 50M corporate penalty |
| QLD TMR / MSQ | Heavy vehicle access (Mt Isa corridor); pilotage reform; port safety | Aurizon/road transport interface; B-double access | Permit violations; liability under CoR |
Compliance Calendar — Annual Key Dates
| Month | Filing / Event | Who | Regulator |
|---|---|---|---|
| July 1 | New financial year — customs tariff schedule updates effective | Customs brokers, importers | ABF |
| July 1 | POTL port tariff new schedule effective | All port users | POTL |
| July–Aug | Annual AMSA vessel certificate renewal peak | Ship operators, agents | AMSA |
| October | Sugar season winding down — QSCT annual maintenance window | Sugar exporters | QSCT/POTL |
| November 1 | Cyclone season commences — activate cyclone preparedness plans | All port operators | POTL/BOM/MSQ |
| January 31 | Annual export statistics report — DAFF | Agricultural exporters | DAFF |
| March 31 | P&I Club renewal season — renew marine insurance | Ship operators | — |
| April 30 | End of cyclone season — deactivate plans, debrief | All port operators | POTL/BOM |
Penalty Schedule — Key Infringements
ABF Penalties
AMSA Penalties
DAFF Penalties
Congestion & Delay Profiles — Nine Major Australian Ports
| Port | Congestion Risk | Peak Period | Primary Delay Driver |
|---|---|---|---|
| Townsville | MODERATE–HIGH | Jun–Dec (sugar season) | DAFF biosecurity holds; FID errors; BL delays |
| Brisbane | HIGH | Nov–Jan; pre-CNY | Road congestion; DAFF inspection peak; gate delays |
| Melbourne | HIGH | Nov–Dec; IR disputes | MUA IR disputes; infrastructure constraints |
| Sydney (Port Botany) | HIGH | Jan; Nov–Dec retail peak | Road access; DAFF holds; ABF exams |
| Fremantle | MODERATE | Grain season Apr–Aug | Wind delays; vessel queue; berth congestion |
| Adelaide | MODERATE | Grain season (variable) | Seasonal grain demand; limited terminal redundancy |
| Darwin | MODERATE | Monsoon Nov–Apr | Monsoon disruption; limited container services |
| Gladstone | LOW–MOD | LNG maintenance periods | Primarily bulk; container volume low |
| Newcastle | LOW–MOD | Coal export peak Q3 | Primarily bulk coal; container demurrage uncommon |
Ten Causes of Demurrage, and What Prevents Each One
Ordered by how often they appear in practice rather than by a measured frequency; the exposure column is a qualitative band, not an industry average. The prevention column is the part worth acting on.
| # | Cause | Typical Exposure | Prevention |
|---|---|---|---|
| 1 | FID errors — wrong HS code, value, description | Moderate | Pre-screen FID 48hr before vessel arrival; use tariff advisor for novel goods |
| 2 | DAFF biosecurity hold — PABR inaccuracy | Short | BICON pre-check; pre-arrange treatment if flagged commodity |
| 3 | Original BL not available / telex release late | Extended | Request telex release at origin; coordinate BL issuance with shipper |
| 4 | CRO not issued — freight unpaid | Short | Confirm freight payment 48hr before vessel arrival |
| 5 | ABF examination selected | Short | Ensure FID accuracy; known importer status reduces exam rate |
| 6 | DG declaration error — cargo held | Extended | DGD pre-lodged; packing cert obtained; MSDS provided to terminal |
| 7 | Transport booking delay | Short | Book cartage on vessel arrival confirmation; don't wait for all clearances |
| 8 | CoR weight discrepancy — gate rejection | Short | Obtain VGM from shipping line; use weighbridge-certified figures |
| 9 | Vessel arrival delay — ETA later than predicted | Variable | Monitor AIS; adjust cartage to actual ETA not predicted |
| 10 | Terminal congestion — gate queues | Short | Book gate slot in off-peak hours; use POTL PortConnect or contact NSS/TML directly |
Detention vs Demurrage
Dispute Resolution
When a Tropical Cyclone Watch is issued by BOM: (1) Contact shipping agent immediately — vessel departure may be advanced or delayed. (2) POTL issues port closure notice if TC Warning issued. (3) All containers at the terminal (NSS / TML) secured and lashed per operator protocol. (4) Confirm cargo insurance covers named storm/cyclone damage. (5) Expect 24–96 hour port closure → 2–5 days demurrage exposure. (6) Monitor POTL operational alerts and BOM. (7) Pre-arrange extended free time or demurrage waiver request with shipping line if TC disruption evident before vessel arrival.
Markets — Commodity Prices & Freight Rates
Met Coal (PLV)
LNG (JKM Spot)
Baltic Dry Index
Market–Port Correlation Matrix — How Prices Move Australian Port Operations
| Price Movement | Direct Port Impact | Key Operators Affected | Secondary Effect | NQ Signal |
|---|---|---|---|---|
| LME Copper ↑ | Glencore Townsville throughput increases; more vessel charters booked | Glencore, NSS, POTL | +Rail utilisation (Aurizon Mt Isa line) | Bullish for Townsville |
| LME Zinc ↑ | McArthur River / Mt Isa concentrate exports increase | Glencore, Aurizon, Teck | +Bulk berth demand at Townsville | Volume uplift |
| AUD/USD ↓ | Higher AUD returns for commodity exporters → production incentive | All commodity exporters | +Export competitiveness, +port throughput | NQ exporters benefit |
| BDI ↑ | Higher vessel freight costs for bulk shippers → margin pressure | Exporters, shipping agents | −Margin for producers if not hedged | Watch cost impact |
| FBX ↑ | Import cost pressure for NQ businesses → demand softening | Freight forwarders, importers | −Import volumes through container berths | Monitor container TEU |
| Sugar ↑ | Lucinda terminal throughput increases; more vessel calls Jun–Dec | Wilmar, MSF, Sucrogen | +Port congestion risk in NQ peak season | Seasonal uplift |
| LNG ↑ | Darwin / Gladstone LNG exports increase; FLNG production incentive | Santos, Woodside, Shell | +Pilotage, towage, marine services demand | Limited NQ impact |
| Iron Ore ↓ | Port Hedland / Dampier throughput softens; fewer Capesize charters | BHP, Rio Tinto, FMG | −BDI; −National maritime services revenue | Minimal Townsville impact |
Seasonal Freight Calendar — Australian Trade Patterns
Peak Season Pressures
Vessel Rate Benchmarks — Australian Context
When freight demand peaks, compliance pressure spikes, and supply chain systems are tested most. Plan cargo movements and operations around this calendar.
June–November is the highest-pressure period on the Townsville waterfront. Sugar exports, live cattle movements, and mineral exports simultaneously peak. This is when operational systems face the greatest stress — and when the ROI of solid compliance systems, document workflows, and cost controls is most visible.
NQ Commodities — Port of Townsville
The Mt Isa–Townsville Aurizon rail corridor (~977km) is the primary inland corridor for Townsville Port's mineral bulk exports. Rail-vessel scheduling synchronisation is the #1 operational risk for NQ mineral exporters.
Mount Isa Mines' underground copper operations closed July 2025 after 70 years. The Townsville copper refinery continues to operate, transitioning to 100% third-party concentrates from NW Queensland and interstate mines. Copper export volumes remain active; supply chain sourcing pathways have shifted. Verified: Glencore QLD Metals, July 2025.
| Commodity | Type | Source / Producer | Volume (approx) | Destination | Seasonality | Key Risk |
|---|---|---|---|---|---|---|
| Copper cathode / anode | Refined metal export | Glencore Townsville refinery (third-party concentrates; govt. support deal to 2028) | ~300K t/yr (cathode) | Japan, Korea, China, India | Year-round | LME price volatility; Aurizon rail disruption |
| Zinc / lead concentrate | Bulk mineral concentrate | Teck (McArthur River), Sun Metals, Glencore | Major NQ concentrate stream | Asian smelters (Japan, Korea, China) | Year-round | DAFF biosecurity; concentrate moisture content |
| Raw sugar | Bulk agricultural export | Wilmar / MSF / Sucrogen (Herbert River, Burdekin) | Major seasonal volume | Japan, Korea, Middle East, Indonesia | Jun–Dec (peak) | ICE No.11 pricing; vessel queue in season |
| Beef / live cattle | Live export | NQ cattle stations (Elders, Wellard, AACo) | ~200K head/yr | Indonesia, Malaysia, Vietnam | Apr–Oct | ESCAS/LGAP compliance; vet inspection hold |
| Manganese ore | Bulk mineral export | GFG Alliance / Glencore | ~300K t/yr | Asian steel mills | Year-round | Dust management; stacking/reclaim constraints |
| Fertiliser (import) | Liquid/dry bulk import | Incitec Pivot, Elders, Landmark | ~150K t/yr | NQ agriculture (cane, horticulture) | Mar–Jun (pre-planting) | IMDG DG compliance; seasonal demand spike |
| Petroleum products (import) | Liquid bulk import | BP, Viva Energy, Ampol | Year-round import stream | NQ fuel distribution network | Year-round | Berth 1 (pipelines only); MSDS required; hose certification; spill plan |
Major Australian Export Commodities — Trade Intelligence
| Commodity | Annual Export Value | Primary Export Port(s) | Key Shipper(s) | Destination | Price Driver | Delay Risk |
|---|---|---|---|---|---|---|
| Iron Ore | ~AUD $116B/yr | Port Hedland, Dampier | BHP, Rio Tinto, FMG | China (70%+), Japan, Korea | China steel output, property sector | 7 |
| LNG (liquefied natural gas) | ~AUD $65B/yr | Gladstone, Darwin, NW Shelf | Santos, Woodside, Shell | Japan, Korea, China, Taiwan | JKM spot, oil linkage, weather | 6 |
| Metallurgical Coal | ~AUD $39B/yr | Newcastle, Dalrymple Bay | BHP, Glencore, Anglo | Japan, India, Korea, EU | Coking coal index (PLV), steelmakers | 8 |
| Copper Concentrate/Anode | Major NQ export earner | Townsville, Port Kembla | Glencore (Townsville refinery) | Japan, Korea, China, India | LME Copper 3-month | 9 |
| Zinc / Lead Concentrate | Major NQ export earner | Townsville | Teck, Sun Metals, Glencore | Asian smelters (Japan, Korea, China) | LME Zinc / LME Lead | 9 |
| Gold (refined bars) | ~AUD $25B/yr | Perth, Sydney (air) | Newmont, AngloGold, Barrick | London, Zurich, Singapore | USD gold spot price | 7 |
| Wheat / Grain | ~AUD $10B/yr | Adelaide, Fremantle, Geelong | CBH, GrainCorp, Viterra | Indonesia, SE Asia, Middle East | CBOT wheat, AUD/USD, crop yield | 8 |
| Raw Sugar | Key QLD agricultural export — ~85% of production exported | Townsville (Lucinda), Mackay | Wilmar, MSF Sugar, Sucrogen | Japan, Korea, Middle East, Indonesia | ICE Sugar No.11 | 8 |
| Beef / Live Cattle | QLD holds ~39% of Australia's national beef herd (MLA 2025) | Townsville, Darwin, Fremantle | Elders, Wellard, MLA | SE Asia, Middle East (Indonesia key) | AUD/IDR, ESCAS compliance | 9 |
| Alumina | ~AUD $8B/yr | Gladstone, Kwinana, Bell Bay | Rio Tinto, Alcoa, South32 | China, Middle East, India | LME Aluminium, bauxite supply | 6 |
Major Australian Import Commodities
| Category | Key Products | Primary Entry Ports | Compliance Risk | Delay Risk |
|---|---|---|---|---|
| Petroleum / Refined Fuels | Diesel, petrol, jet fuel, LPG | Melbourne, Sydney, Townsville (fuel berth) | DGR, MSDS, ADG Code | 7 |
| Motor Vehicles | Cars, trucks, agricultural machinery | Melbourne, Fremantle, Brisbane | ADR compliance, AQIS biosecurity | 6 |
| Consumer Goods / FCL | Electronics, clothing, furniture, food | Sydney, Melbourne, Brisbane | FID accuracy, HS code, DAFF inspection | 8 |
| Chemicals / Fertiliser | Urea, DAP, MAP, industrial chemicals | Townsville, Geelong, Kwinana | MSDS, IMDG, DGR — high compliance load | 9 |
| Steel / Metals | Steel coil, structural steel, aluminium | Melbourne, Port Kembla, Townsville | Anti-dumping duties, origin declaration | 7 |
| Food & Agricultural Products | Grains, horticulture, processed foods | All major ports (DAFF at all) | DAFF biosecurity highest risk category | 9 |
Commodity Register — Live from the FlowManager Knowledge Graph
The commodities that define North Queensland's trade economy, synced from the FlowManager intelligence database and grouped by category.
NQ Supply Chain System — Interactive Stakeholder Map
Open full-screen map ↗Filter by commodity corridor, hover any node or trade lane for intelligence detail. Five gateways, five commodity corridors — minerals, coal, sugar, cattle and bauxite. For the most detail, open the full-screen map above.
Supply Chain Flow Maps — NQ's Three Primary Chains
NQ Logistics Seasonal Calendar
Where the System Breaks Down — Bottlenecks by Stakeholder
Port Network — The Physical Backbone of the Corridor
North Queensland Ports — Strategic Rankings
Eight ports serve the North Queensland corridor. Understanding their relative strategic weight is essential for supply chain design, market entry, and trade intelligence. Source: NQBP ↗ · POTL ↗ · Abbot Point ↗
| # | Port | Strategic Position | Primary Commodities | Port Authority | NQ Signal |
|---|---|---|---|---|---|
| 1 | Townsville | Most diversified and strategic — containers, minerals, sugar, livestock, defence, cruise | Cu, Zn, Pb concentrate · Raw sugar · Livestock · Containers | POTL / NQBP ↗ | NQ Hub |
| 2 | Hay Point | Largest trade volume — dedicated coal terminal, high-throughput Capesize operations | Metallurgical & thermal coal | NQBP ↗ | Volume |
| 3 | Abbot Point | Major coal exports — Bowen Basin gateway, ~35Mt/yr actual, 50Mtpa capacity (NQBP) | Thermal coal · Potential future minerals | NQBP ↗ | Coal |
| 4 | Weipa | Global bauxite hub — Rio Tinto captive port, one of the world's largest bauxite operations | Bauxite | Rio Tinto ↗ | Bauxite |
| 5 | Cairns | Regional logistics + tourism — gateway to FNQ, cruise, defence, general cargo | General cargo · Cruise · Defence · Agri | Cairns Port ↗ | Regional |
| 6 | Mackay | Multi-cargo regional port — sugar, coal, general cargo, supporting Bowen Basin hinterland | Sugar · Coal · General cargo | NQBP ↗ | Multi |
| 7 | Lucinda | Sugar specialist — Southern Hemisphere's longest bulk sugar loading jetty (5.76 km), purely seasonal | Raw sugar (Jun–Dec) | NQBP ↗ | Sugar |
| 8 | Mourilyan | Regional agricultural port — sugar and agricultural exports for the Innisfail / FNQ region | Raw sugar · Agricultural exports | NQBP ↗ | Agri |
Australia's 11 Major Ports — Full Network Intelligence
Throughput Ranking — Australia's Major Ports
| Rank | Port | State | Total Throughput | Container TEU/yr | Primary Cargo | Port Authority | Key Risk |
|---|---|---|---|---|---|---|---|
| 1 | Port Hedland | WA | ~578M t | — | Iron ore | Pilbara Ports Authority | Cyclone disruption |
| 2 | Port Dampier | WA | ~140M t | — | Iron ore, LNG | Pilbara Ports Authority | NW Shelf cyclones |
| 3 | Newcastle | NSW | ~165M t | — | Coal | Port of Newcastle | Rail/vessel queue |
| 4 | Gladstone | QLD | ~100M t | — | LNG, coal, alumina | Gladstone Ports Corp | GBR proximity |
| 5 | Melbourne | VIC | — | ~3.4M TEU | Containers | Port of Melbourne | IR disputes |
| 6 | Port Botany | NSW | — | ~2.7M TEU | Containers | NSW Ports | Road congestion |
| 7 | Brisbane | QLD | — | ~1.6M TEU | Containers, bulk | Port of Brisbane Pty | Flood risk |
| 8 | Fremantle | WA | — | ~890K TEU | Containers, grain | Fremantle Ports | Wind/berth delays |
| 9 | Adelaide | SA | ~25M t | ~350K TEU | Grain, containers | Flinders Ports | Grain variability |
| 10 | Townsville | QLD | ~7M t | ~59K TEU | Cu, Zn, Pb, Sugar | POTL / NQBP | Cyclone, rail link |
| 11 | Darwin | NT | ~4.5M t | ~65K TEU | LNG, live export | Darwin Port Corp | Monsoon, strategic |
Port of Townsville — Official Berth Information (Source: POTL Berths & Capability ↗ · townsvilleport.com.au · Berth Information Amendment as at March 2025)
| Berth | Operator / Priority User | Cargo & Commodity | Key Facilities | Max Vessel LOA | Design Depth (m LAT) | Bunker Fuel |
|---|---|---|---|---|---|---|
| Berth 1 | Common user | Petroleum products · Sulphuric acid | Pipelines & manifold connection · Firefighting infrastructure | 229m | 14.5 | Pipeline only |
| Berth 2 | Glencore | Concentrates / Ore | Portainer crane (55 t) · Hoppers & conveyor | 238m | 12.2 | Truck |
| Berth 3 | Common user | Containers · Break bulk · Dry bulk · Live Cattle · Motor Vehicles | Portainer crane (55 t) · 2× mobile harbour cranes (124 t, 150 t) · Quarantine wash bay · 96 reefer outlets | 238m | 12.2 | Truck |
| Berth 4 | Common user | Containers · Break bulk · Cement · Molasses · Motor Vehicles | Molasses / Bitumen / Caustic soda / Cement pipelines · STS Container Crane | 238m | 12.2 | Truck |
| Berth 8 | Common user · Priority: Glencore | Concentrates · Fertiliser · Molasses · Break bulk | Ship loader · Molasses pipeline | 220m | 14.3 | Truck |
| Berth 9 | Common user · Priority: QSL | Sugar · Containers · Break bulk · Motor Vehicles | Ship loader · Molasses pipeline | 228m | 12.5 | Pipeline & Truck |
| Berth 10 | Defence · Cruise · Common user | Containers · Break bulk · Motor vehicles · Live cattle | Mobile harbour crane 140 t (Aurizon) · Quarantine wash bay · 12 reefer outlets | 306m | 13.3 | Pipeline & Truck |
| Berth 11 | South32 | Concentrates | Ship loader | 225m | 12.2 | None |
Total vessel calls
Port Authority
Towage
Port Profiles — Live from the FlowManager Knowledge Graph
Verified port facility data, synced from the FlowManager intelligence database. Figures cross-checked against port authority and primary government sources.
NQ Infrastructure & Project Watch — Live
The capital projects reshaping North Queensland's freight corridor — port expansions, energy corridors and critical-minerals developments.
Container Shipping Lines — Australian Network (Free)
| Shipping Line | Alliance | Australian Ports | Main Trade | Frequency | Agent (Australia) |
|---|---|---|---|---|---|
| Maersk | Gemini (Hapag) | Melbourne, Sydney, Brisbane, Fremantle, Adelaide | Asia–Australia, Europe–Australia | Weekly | Maersk Australia Pty |
| MSC | Independent (from 2025) | Melbourne, Sydney, Brisbane, Fremantle, Adelaide | Asia–AU, Med–AU | Weekly | MSC Australia |
| CMA CGM | Ocean Alliance | Melbourne, Sydney, Brisbane, Fremantle | Asia–Australia, Pacific | Weekly | ANL Container Line |
| Evergreen | Ocean Alliance | Melbourne, Sydney, Brisbane, Fremantle | Asia–Australia | Weekly | Evergreen Shipping Agency |
| COSCO / OOCL | Ocean Alliance | Melbourne, Sydney, Brisbane, Fremantle, Adelaide | Asia–Australia | Weekly | COSCO Shipping Lines AU |
| ONE (Ocean Network Express) | THE Alliance | Melbourne, Sydney, Brisbane, Fremantle | Asia–Australia | Weekly | ONE Australia |
| Hapag-Lloyd | Gemini (Maersk) | Melbourne, Sydney, Brisbane, Fremantle | Asia–AU, Europe–AU | Weekly | Hapag-Lloyd Australia |
| Yang Ming | THE Alliance | Melbourne, Sydney, Brisbane | Asia–Australia | Weekly | Yang Ming (Australia) |
| PIL (Pacific Intl Lines) | — | Brisbane, Townsville, Darwin, Pacific | North Asia–NQ–Pacific Islands | Fortnightly | PIL Australia / Sofrana |
| Swire Shipping | — | Townsville, Cairns, Darwin, Pacific | Australia–PNG–Pacific Islands | ~Fortnightly | Swire Shipping (Brisbane) |
Townsville Shipping Services — NQ Deep Dive
| Operator | Service Type | Route | Frequency | Cargo | NQ Agent |
|---|---|---|---|---|---|
| Sofrana Unilines | FCL/LCL + Breakbulk | Townsville – Pacific Islands (Fiji, Vanuatu, NC, Solomon Is.) | ~Weekly | General cargo, containers, project | Sofrana (Townsville) |
| Swire Shipping | FCL + Breakbulk | Townsville – PNG – Pacific | ~Fortnightly | General, containers, project, hazmat | Swire (Brisbane/Townsville) |
| MSC/Maersk feeder | FCL containers | Asia → Brisbane → Townsville (feeder) | ~Weekly feeder | Import containers to NQ | NSS / TML (Townsville) |
| Glencore charter vessels | Bulk mineral export | Townsville – Japanese/Korean/Chinese smelters | ~12–16 charters/yr | Copper anode, zinc/lead concentrate | Glencore (direct) |
| Sugar charter vessels | Bulk sugar export | Lucinda / Townsville – Asia / Middle East | Seasonal Jun–Dec | Raw sugar (seasonal) | Wilmar / QSCT |
| Livestock vessels | Live export | Townsville – SE Asia (Indonesia, Malaysia, Vietnam) | Seasonal Apr–Oct | Cattle (~200K head/yr) | Elders / Wellard |
| Fuel tankers | Liquid bulk import | Brisbane / Singapore – Townsville (Berth 1) | ~Monthly per product | Diesel, petrol, jet fuel | BP / Viva Energy |
Total vessel calls
Container TEU
Bulk throughput
Pacific Islands & Specialist Services — Townsville
| Operator | Service | Route | Vessel DWT | Freq | Cargo |
|---|---|---|---|---|---|
| Sofrana Unilines | FCL/LCL + Breakbulk | Townsville → Fiji, Vanuatu, New Caledonia, Solomon Islands | 5,000–8,000 DWT | Weekly | General cargo, containers, project, refrigerated |
| Swire Shipping | FCL + Breakbulk | Townsville → PNG (Lae, Port Moresby) → Pacific | 8,000–12,000 DWT | Fortnightly | General, containers, project, hazmat |
| Glencore Charter Fleet | Bulk mineral export | Townsville → Japanese/Korean/Chinese smelters | 25,000–45,000 DWT (Handysize/Supra) | ~12–16 charters/yr | Copper anode, zinc/lead concentrate |
| QSCT Sugar Vessels | Bulk sugar export | Lucinda/Townsville → Japan, Korea, Middle East | 15,000–30,000 DWT (Handymax) | Seasonal Jun–Dec | Raw sugar (~50 vessels/season) |
| RoRo Operators | Vehicle/RoRo import | Japan/Korea → Melbourne → Townsville | 15,000–25,000 GT | Monthly | Agricultural machinery, vehicles, mining equipment |
| Project Cargo Specialists | Heavy lift / breakbulk | Global → Townsville (Berth 9) | Various — 70t crane on site | Ad hoc | Mining plant, industrial modules, wind turbines |
Australia's Key Export Trade Lanes
| Corridor | Commodity | Origin Port(s) | Destination | Annual Volume | Vessel Type | Transit Time |
|---|---|---|---|---|---|---|
| WA Pilbara → China / Japan / Korea | Iron Ore | Port Hedland, Dampier | Chinese steel mills, Japan, Korea | Dominant global iron-ore lane | Capesize VLOC (200–400K DWT) | 7–12 days |
| QLD / NSW → Japan / India / EU | Metallurgical Coal | Newcastle, Dalrymple Bay, Hay Point | Japan, India, Korea, EU | Major metallurgical-coal lane | Capesize / Panamax | 7–30 days |
| NQ Townsville → Asian Smelters | Copper / Zinc / Lead | Townsville (Glencore, Teck, Sun Metals) | Japan, Korea, China smelters | Combined base-metal stream | Handymax / Supramax (35–58K DWT) | 8–18 days |
| NQ Lucinda/Townsville → Asia / ME | Raw Sugar | Lucinda, Townsville (Wilmar, MSF) | Japan, Korea, Middle East, Indonesia | Seasonal volume | Handysize / Supramax | 8–25 days |
| Townsville → Pacific Islands | General cargo / containers | Townsville (Sofrana, Swire, PIL) | Fiji, PNG, Vanuatu, Solomon Is., NC | ~15K TEU/yr | MPP / Feeder (2–5K DWT) | 3–10 days |
| WA Grain Belt → SE Asia / Middle East | Wheat / Barley / Canola | Fremantle, Albany, Geraldton | Indonesia, SE Asia, Middle East | ~20M t/yr | Handymax / Panamax | 10–25 days |
Port of Townsville — Official Shipping Charges 2025–2026
Effective 1 July 2025. All rates ex-GST unless noted.
| Type | Ex GST | Inc GST |
|---|---|---|
| Full TEU (20ft) | $129.50 | $142.45 |
| Full FEU (40ft) | $259.00 | $284.90 |
| Empty TEU | $20.11 | $22.12 |
| Type | Ex GST | Inc GST |
|---|---|---|
| Full TEU (20ft) | $100.69 | $110.76 |
| Full FEU (40ft) | $201.38 | $221.52 |
| Empty TEU | $20.11 | $22.12 |
| Non-Container Wharfage — Export | Unit | Ex GST | Inc GST |
|---|---|---|---|
| Dry Bulk (Townsville berths) | /t | $5.06 | $5.57 |
| Sugar — Lucinda terminal | /t | $1.13 | $1.24 |
| Oil / Petroleum | /t | $6.06 | $6.67 |
| Livestock (cattle) — live export | /head | $3.14 | $3.45 |
| Refined Metals (copper anode etc.) | /t | $6.26 | $6.89 |
| Heavy Lift | /t | $6.26 | $6.89 |
| Time at Berth | Rate Basis | Ex GST | Inc GST |
|---|---|---|---|
| All cargo vessels | GRT × Hours | $0.02781/GRT/hr | $0.03059/GRT/hr |
| Cruise vessels (>1,000 GRT) | Per 12-hour period | $12,885.54 | $14,174.09 |
Sugar export wharfage at Lucinda ($1.13/t) is one of the lowest bulk rates in Australia. Compare to copper/refined metals at $6.26/t — reflecting the higher port service requirement for mineral concentrate handling.
Where North Queensland's cargo goes
The export corridors that carry NQ commodities to market — copper/zinc/lead to Asian smelters, raw sugar to Japan and the Middle East, containers to the Pacific Islands. Includes a 7-item Strategic NQ Supply Chain Intelligence table covering AUKUS, India-ECTA, CII ratings and energy transition impacts.
Australian Maritime & Trade Regulatory Framework
| Legislation / Instrument | Regulator | Who It Applies To | Key Obligation | Penalty (max) |
|---|---|---|---|---|
| Customs Act 1901 | ABF | All importers / exporters | Import/export declaration, duty payment, prohibited goods | AUD 1M+ / imprisonment |
| Biosecurity Act 2015 | DAFF | All cargo, vessels, persons | Biosecurity risk management; BICON compliance; treatment | AUD 2.1M corporate / imprisonment |
| Navigation Act 2012 | AMSA | All vessels in Australian waters | SOLAS, MARPOL, MLC compliance; certificates current | Vessel detention; AUD 500K+ |
| Maritime Transport Security Act 2003 | Home Affairs | Port operators, shipping lines | ISPS Code; Maritime Security Plans; access control | AUD 2M+; infrastructure shutdown |
| AMSA Marine Order 42 (DG) | AMSA | DG shippers, agents, terminals | IMDG Code compliance; packing, labelling, declaration | AUD 500K; cargo rejection |
| Chain of Responsibility (CoR) | NHVR / State | All supply chain parties | Mass, dimension, speed, load restraint compliance | AUD 200K+ personal; criminal liability |
| ESCAS / LGAP | DAFF | Live cattle / livestock exporters | Traceability, animal welfare, supply chain verification | Export licence suspension / revocation |
| Export Control Act 2020 | DAFF | Agricultural / food exporters | Export permits, NEXDOC registration, standards compliance | AUD 1.1M; export ban |
| MARPOL 73/78 (Oil Record Book) | AMSA / AMSA PSC | Ship Masters / Chief Engineers | Accurate ORB entries; GBR heightened enforcement | Criminal prosecution; AUD 1M+ |
| Competition & Consumer Act 2010 | ACCC | All port operators, shipping lines | Anti-competitive conduct; misuse of market power | AUD 50M+ corporate |
| Dangerous Goods Safety Acts (State) | State Regulators | DG handlers, terminals | Storage, handling, transport of Class 1–9 DG | Varies by state — significant |
Regulatory Radar · last reviewed 18 August 2026 · items carry their own dates
From ICS release 26.4.01, Cargo Report Numbers identifying sub-manifests move to an Idle and Revoked status framework aligned with Export Declaration Numbers. A CRN goes Idle if it is not linked to a manifest, or lacks CTO “received” status, within 10 days of the reported date of departure — then Revoked after a further 30 days without corrective action. Linked lines and associated EDNs can go Idle with it. Cargo reporters and brokers need a routine for responding to ICS Idle Advice messages rather than letting stale CRNs age out. Separately, note the standing obligation: the Sea Cargo Report and Cargo List Report are lodged a maximum of 48 hours before ETA at the first Australian port, with shorter timeframes on shorter voyages. Sources: ABF ICS enhancement fact sheet · ABF cargo reporter obligations.
DAFF has reinforced the enhanced biosecurity inspection regime for all vessels and cargo entering ports within the Great Barrier Reef proximity zone (Townsville, Cairns, Mackay, Gladstone). Pre-arrival biosecurity report (PABR) accuracy is under heightened scrutiny. Average inspection hold: 4–18 hours. Commodity types flagged: fresh produce, plant material, live animals, soil.
AMSA has identified MLC 2006 (Maritime Labour Convention) as a priority for Port State Control inspections nationally through Q3 2026. Vessels with outstanding MLC deficiencies from prior port calls face expedited inspection. Townsville and Brisbane are designated enhanced inspection ports. Key items: wage records, seafarer accommodation standards, work/rest hours.
ABF cargo intervention is risk-based, and a vague goods description is one of the few risk factors entirely within a broker’s control. Generic wording such as “general merchandise”, “spare parts” or “samples” gives the system nothing to assess against, and the practical consequence is a longer path to clearance. Write the description to the goods, not to the invoice header. This is standing good practice rather than a new instrument.
Import conditions for plant products (fresh herbs, cut flowers, seeds and propagative material) change without a broad announcement, and permit requirements can differ by country of origin and end use for what looks like the same commodity. The only safe practice for NQ importers bringing agricultural inputs through Townsville is to re-check BICON at the time of each consignment. The Review does not republish BICON conditions, because a cached condition is a wrong condition.
AMSA has identified tween-deck general cargo vessels as a priority PSC inspection category, particularly regarding fixed CO2 fire suppression systems. Vessels calling Townsville with tween-deck configuration should ensure certificates are current and systems tested within 12 months.
Queensland Transport and Main Roads has updated access conditions for B-double and road train combinations on the Flinders Highway (Townsville–Mt Isa). Restricted access during wet season weather events. Operators transporting mining supplies must hold current PBS (Performance Based Standards) approval. Check TMR NHVR portal for current conditions.
The IMO Carbon Intensity Indicator (CII) rating (A–E scale) is now materially affecting vessel charter decisions. NQ operators chartering bulk vessels: confirm CII rating before agreeing charter. D-rated or E-rated vessels may face operational restrictions. Glencore and major mining companies now specify minimum CII rating in charter party requirements.
Active Australian Free Trade Agreements — Duty Optimisation Intelligence
| FTA | Partner(s) | In Force | Status | Key Tariff Reduction | CoO Requirement |
|---|---|---|---|---|---|
| ChAFTA | China | 2015 | Active | Most goods now 0% duty. Steel/aluminium sensitive sectors remain. | Form A or approved origin declaration |
| JAEPA | Japan | 2015 | Active | Beef 38.5% → 19.5–23.5% (staged, 15–18 yrs). Dairy, wheat substantial reductions. | Certificate of Origin — exporter self-cert |
| KAFTA | South Korea | 2014 | Active | Goods tariffs essentially eliminated. Services liberalised. | Form AK or approved declaration |
| AUSFTA | USA | 2005 | Active | Most industrial goods duty-free. Agriculture sensitive — tariff-rate quotas. | Exporter declaration (no specific form) |
| ANZCERTA | New Zealand | 1983 | Active | Comprehensive duty-free trade — goods and services. | Certificate or declaration; very flexible |
| AIFTA | ASEAN (incl. Indonesia) | 2010 | Active | Substantial tariff reductions. Indonesia beef/live export relevant for NQ. | Form AANZ or ASEAN-standard CoO |
| AUSFTA (India — ECTA) | India | 2022 | Partial — ECTA | Interim ECTA: >80% of goods. Full FTA negotiations ongoing. | CoO per ECTA rules of origin |
| A-UK FTA | United Kingdom | 2023 | Active | 99%+ of AU goods duty-free immediately. Beef tariffs eliminated over 10 yrs. | Exporter declaration; preferential origin rules |
Key Regulatory Contacts — NQ / Townsville
ABF · 1800 020 010
DAFF Biosecurity · 1800 900 090
AMSA · 1800 627 484
MSQ · 1800 636 853
Top Documents by Delay Risk — NQ Port Network
150+ document types scored on delay risk, financial risk, error frequency, and compliance consequence across 15 phases of the Port of Townsville trade cycle.
| # | Document | Stakeholder / Phase | Score | Key Risk |
|---|---|---|---|---|
| 1 | Bill of Lading (Original) | Ship Master / Shipping Agent | 10 | Document of title — without it cargo cannot legally be released. Only document scoring 10/10 on BOTH delay and financial risk. |
| 2 | Vessel Detention Notice | AMSA Port State Control | 10 | Vessel physically cannot sail; all cargo frozen; berth blocked. USD 15,000–50,000/day cost. |
| 3 | Notice of Readiness (NOR) | Shipping Agent | 9 | Triggers laytime — incorrect NOR = charter party dispute; AUD thousands/hour at stake. |
| 4 | Full Import Declaration (FID) | Customs Broker / ABF | 9 | Goods cannot be released until FID accepted; errors trigger ABF queries and extend free time toward demurrage. |
| 5 | ICS Inward Cargo Manifest | ABF / Shipping Agent | 9 | All import processing depends on manifest accuracy; errors = all containers on that manifest held. |
Demurrage & Free Time Intelligence
Top 20 Documents by Delay Risk — Built from 15-Phase Analysis of 150+ Documents
Derived from a complete 15-phase Document Intelligence Analysis of the Port of Townsville trade cycle. 150+ document types scored on delay risk (1–10), financial risk (1–10), error frequency, compliance consequence, automation opportunity, and commercial opportunity. The Bill of Lading is the only document to score 10/10 on BOTH delay and financial risk.
| # | Document | Stakeholder / Phase | Score | Key Risk / Reason |
|---|---|---|---|---|
| 1 | Bill of Lading (Original) | Ship Master / Shipping Agent (Ph 5,9,14) | 10 | Document of title — without it cargo cannot legally be released; vessel cannot discharge; entire supply chain stops. Only document scoring 10/10 on BOTH delay and financial risk. |
| 2 | Vessel Detention Notice | AMSA PSC (Ph 12) | 10 | Vessel physically cannot sail; all cargo on board frozen; berth blocked; cascading port disruption. USD 15,000–50,000/day cost. |
| 3 | Notice of Readiness (NOR) | Shipping Agent (Ph 5) | 9 | Triggers laytime — incorrect NOR = charter party dispute; rejected NOR = laytime never formally starts; AUD thousands/hour at stake. |
| 4 | Full Import Declaration (FID) | Customs Broker / ABF (Ph 4,10) | 9 | Goods cannot be released until FID accepted; errors trigger ABF queries; DAFF hold overlaps extend free time to demurrage territory. |
| 5 | ICS Inward Cargo Manifest | ABF / Shipping Agent (Ph 5,10) | 9 | All import processing depends on manifest accuracy; manifest errors = all containers on that manifest held pending correction. |
| # | Document | Stakeholder / Phase | Score | Key Risk / Reason |
|---|---|---|---|---|
| 6 | DAFF Biosecurity Direction / Hold Order | DAFF / Importer (Ph 10) | 9 | Entire consignment on hold pending inspection or treatment. GBR proximity: avg 4–18hr hold. Treatment may take 24–96hrs. All downstream logistics frozen. |
| 7 | Dangerous Goods Declaration (DGD) | Shipper / Forwarder (Ph 1,3) | 9 | Error = cargo rejection at port gate or terminal refusal. IMDG non-compliance triggers AMSA Marine Order 42. Entire vessel may be delayed pending correction. |
| 8 | Certificate of Origin (CoO) | Exporter / Customs Broker (Ph 6) | 8 | Missing or incorrect CoO = full MFN duty applied instead of FTA rate. Must match BL and invoice exactly. Form A / Form AANZ discrepancies are common. |
| 9 | Free Time & Storage Invoice | Terminal Operator (Ph 13) | 8 | Document converting delays into cash costs. Every day over free time generates this invoice. Dispute window narrow — typically 14 days from invoice date. |
| 10 | Laytime Statement of Facts (SoF) | Shipping Agent / Master (Ph 5,8) | 8 | Laytime calculation basis for demurrage disputes. Incorrect SoF = incorrect demurrage calculation. Agent must attend all cargo operations to sign accurate SoF. |
| 11 | Mate's Receipt | Ship's Officer / Shipper (Ph 5) | 7 | Pre-BL cargo condition document. Claused Mate's Receipt = claused BL = LC discrepancy. Shipper must ensure cargo presented in good order to avoid clause. |
| 12 | Notice of Readiness (NOR) | Ship Agent / Master (Ph 5) | 9 | Triggers laytime under charter party. Invalid NOR = laytime dispute. Must be tendered in writing; WIBON/WIPON terms critical. AUD thousands/hour at stake. |
| 13 | Fumigation Certificate | Pest Control Operator / DAFF (Ph 2,10) | 7 | Missing = DAFF orders fumigation on arrival at importer cost (+4–24hr delay). Required for timber packaging, certain food grains, plant material. |
| 14 | Phytosanitary Certificate | Exporting country NPPO (Ph 2) | 8 | Required for all plant products. Incorrect or missing = DAFF automatic hold. Cannot be obtained after shipment — must be issued at origin before loading. |
| 15 | Packing Declaration | Shipper / Forwarder (Ph 3) | 7 | DAFF requires packing declaration for all containerised imports. Missing = DAFF opens and inspects entire container. Common cause of avoidable inspections. |
| 16 | Marine Cargo Insurance Certificate | Importer / Insurance Broker (Ph 15) | 7 | All-risks vs. named perils distinction. Many SME importers discover inadequate cover after a claim. ICC A (all-risks) recommended for NQ cargo. |
| 17 | Commercial Invoice (Customs value) | Exporter / Importer (Ph 4) | 8 | Must match FID exactly. Value, description, quantity, origin discrepancies trigger ABF query. Must show transaction value including all costs to Australian port. |
| 18 | Draft Survey Report | Surveyor / Shipping Agent (Ph 8) | 6 | Bulk cargo quantity determination. Disputed draft survey = quantity dispute = potential demurrage and claims. Appoint independent surveyor for high-value bulk cargoes. |
| 19 | Port Health Clearance | DAFF / Ship Agent (Ph 6) | 7 | Required before crew disembarkation in some cases. Vessels from higher-risk origins may require pre-arrival health screening. Can delay port operations. |
| 20 | Telex Release / Sea Waybill | Shipping Line / Agent (Ph 9) | 8 | Used instead of Original BL — but requires shipper's explicit authorisation. Telex release confirmation must be received by destination agent before cargo release. Confusion with OBL surrender causes significant delay. |
| # | Document | Stakeholder / Phase | Score | Financial Risk Reason |
|---|---|---|---|---|
| 1 | Bill of Lading (Original) | Shipping Agent / Bank (Ph 5,9,14) | 10 | Cargo title document; Hague-Visby liability; demurrage trigger; LC compliance; cargo loss exposure. |
| 2 | Vessel Detention Notice | AMSA (Ph 12) | 10 | USD 15,000–50,000/day detention cost; cascading demurrage on all cargo; P&I Club engagement; criminal liability. |
| 3 | Free Time & Storage Invoice | Terminal Operator (Ph 13) | 10 | The demurrage document itself — converts all upstream delays into AUD/day storage charges. Every container in Australia generates a free time calculation. |
| 4 | Marine Cargo Insurance Policy | Broker / Importer (Ph 15) | 10 | Inadequate cover = uncovered cargo loss; all-risks vs. named perils distinction misunderstood by most SME importers. |
| 5 | Letter of Credit (LC) Document Set | Bank / Importer / Exporter (Ph 14,15) | 10 | 50–70% global first-presentation discrepancy rate; USD 8B+ annual cost globally. LC discrepancies freeze payment and cargo simultaneously. |
| # | Document | Financial Risk | Error Frequency | Compliance Risk | Key Exposure |
|---|---|---|---|---|---|
| 1 | Bill of Lading (Original) | 10 | Medium | Very High | Title document; Hague-Visby liability; LC compliance; entire cargo value at risk |
| 2 | Vessel Detention Notice | 10 | Low | Critical | USD 15K–50K/day; cascading demurrage on all cargo; P&I Club engagement required |
| 3 | Free Time & Storage Invoice | 10 | High | High | Every upstream delay converts to AUD charges; dispute window only 14 days |
| 4 | Marine Cargo Insurance Policy | 10 | Medium | High | Uncovered cargo loss; all-risks vs. named perils misunderstood by most SME importers |
| 5 | Letter of Credit (LC) Document Set | 10 | Very High (50–70%) | Very High | USD 8B+ annual global cost; payment freeze and cargo freeze simultaneously |
| 6 | Charter Party (Voyage/Time) | 9 | Medium | High | Laytime/demurrage exposure; off-hire clauses; bunker cost exposure if TC |
| 7 | Full Import Declaration (FID) | 9 | High | Very High | Duty underpayment penalty; ABF audit exposure; cargo hold costs accumulate daily |
| 8 | Certificate of Origin (CoO) | 8 | High | Very High | Full MFN duty applied if missing/incorrect; FTA savings entirely forfeited |
| 9 | Dangerous Goods Declaration (DGD) | 8 | High | Critical | Cargo rejection; vessel delay; AMSA MO42 fine; criminal liability (worst case) |
| 10 | DAFF Biosecurity Direction | 8 | Medium | Very High | Cargo destruction at importer cost; import prohibition; AUD 2.1M corporate penalty |
Top Commercial Opportunities — SaaS Products Identified
| Rank | Product | Category | Commercial Score | Revenue Model |
|---|---|---|---|---|
| 1 | FreeTime Pro™ — Free Time & Demurrage Management | Terminal / Importer / Shipping Line | 10 | AUD $200–5,000/month by role; all-stakeholder free time tracker + dispute workflow |
| 2 | LCCheck Pro™ — LC Document Examination | Bank / Importer / Exporter | 10 | AI-assisted LC compliance check; per-presentation fee + subscription |
| 3 | ImportIQ™ — Import Management Platform | SME Importers | 9 | AUD $300–800/month; import workflow, HS code check, duty estimate, DAFF pre-screen |
| 4 | FTAMax™ — FTA Duty Optimisation & CoO | Importers / Customs Brokers | 9 | AUD $400–1,500/month; FTA eligibility check + CoO management |
| 5 | TermGate Pro™ — Terminal Gate Automation | Terminal Operators | 9 | AUD $5,000–25,000/month; OCR + weighbridge + ABF/DAFF API integration |
From VGM management (Phase 1) to LC document examination (Phase 15). Full product roadmap and investment case available as an advisory deliverable. Contact Us to discuss.
Demurrage & Detention — What the Carrier Tariffs Actually Say
The Review does not publish an industry-wide demurrage cost estimate, because no Australian primary source publishes one. What is published below is drawn from carrier tariffs read directly from the lines’ own documents — Maersk, ANL/CMA CGM, ONE and Swire — and mirrored into the calculator further down this page. Where a carrier does not publish an Australian tariff (PIL, COSCO, Yang Ming, Evergreen), no rate is shown rather than an inferred one. The operational point stands without a headline number: demurrage is overwhelmingly triggered by paperwork and coordination, both of which sit upstream of the terminal and inside the importer’s control.
Free Time Published
Rate Once Free Time Ends
Townsville Carve-Out
Tariff Records Tracked
| Trigger Event | Responsible Party | Stop Condition | Typical Cost | Prevention |
|---|---|---|---|---|
| Vessel arrives, NOR tendered | Shipping Agent | Cargo fully loaded/discharged | Vessel demurrage — set by the charter party, not the container tariff | Pre-arrival planning; gang sequence confirmed |
| Container discharged, free time starts | Terminal / Shipping Line | Container collected by importer | Carrier tariff rate — run the calculator below | FID pre-lodged; customs release pre-obtained |
| DAFF biosecurity hold placed | DAFF (importer's cargo) | Inspection cleared / treatment completed | Carrier tariff rate, plus DAFF treatment cost | PABR accuracy; BICON pre-check; treatment pre-arranged |
| ABF holds cargo for examination | ABF (triggered by FID error) | FID corrected and re-lodged; examination cleared | Carrier tariff rate, plus terminal storage | FID lodged ahead of arrival; HS code verified; sea cargo report in by the 48-hour mark |
| Original BL not available at discharge | Shipper / Bank / Exporter | OBL surrendered or Letter of Indemnity issued | $500K+ potential liability + demurrage | BL issued early; LC presentation prepared in advance |
| Container Release Order (CRO) not issued | Shipping Line / Shipping Agent | Freight paid; CRO issued to terminal | Carrier tariff rate for every day the CRO is outstanding | Freight payment confirmed before vessel arrival |
| DG declaration error — cargo held | Shipper / Freight Forwarder | Corrected declaration accepted by AMSA/terminal | $500–$2,000/day + potential cargo rejection | DGD verified against IMDG; packing cert obtained |
| CoR weight discrepancy — gate rejection | Transport company / shipper | Correct weight declared; vehicle cleared | Delay cost + potential fine + redelivery | VGM/weighbridge certification before gate-in |
| Missing or incorrect Certificate of Origin | Exporter / Customs Broker | Correct CoO provided; preferential duty claimed | Full duty rate applied; potential penalty | FTA eligibility confirmed; CoO issued pre-shipment |
Demurrage Exposure by Port — Free: Melbourne · Sydney · Townsville
Port of Melbourne
Port Botany (Sydney)
Port of Townsville
Full Demurrage Profiles — Brisbane · Fremantle · Adelaide · Darwin · Gladstone · Newcastle
Port of Brisbane
Port of Fremantle
Port Adelaide
Port Darwin
Port of Gladstone
Port of Newcastle
1. Pre-lodge FID with customs broker and confirm ABF clearance status (≥48hr before ETA). 2. Submit DAFF PABR — critical for GBR proximity ports. 3. Confirm freight payment and request CRO from shipping line. 4. Confirm OBL or telex release is available. 5. Book cartage within free time window. 6. If DG cargo: confirm DGD pre-lodged with terminal and AMSA. 7. Check AIS for vessel delays — adjust cartage booking to actual ETA.
Detention & Demurrage Calculator — Built on Verified Carrier Tariffs
What will those extra days actually cost?
This calculator runs on the published Australian detention & demurrage tariffs of major shipping lines, verified against each carrier's official tariff page. Pick your line, port region and container type — free days and tiered daily rates fill in automatically, including the more favourable North Queensland free-time carve-outs where a carrier publishes one. Every figure stays editable, so you can override with your contracted rates.
Estimate only, based on carrier published tariffs (verified 12 June 2026). Day-counting conventions, contracted free time and negotiated rates vary by agreement — always confirm against your service contract and the carrier's invoice. Port and terminal storage charges are separate and not included.
Verified Carrier Tariff Schedules — Australia
Australia's Key Export Trade Lanes
| Corridor | Commodity | Origin Port(s) | Destination | Annual Volume | Vessel Type | Transit Time |
|---|---|---|---|---|---|---|
| WA Pilbara → China / Japan / Korea | Iron Ore | Port Hedland, Dampier | Chinese steel mills, Japan, Korea | Dominant global iron-ore lane | Capesize VLOC (200–400K DWT) | 7–12 days |
| QLD / NSW → Japan / India / EU | Metallurgical Coal | Newcastle, Dalrymple Bay, Hay Point | Japan, India, Korea, EU | Major metallurgical-coal lane | Capesize / Panamax | 7–30 days |
| Gladstone / Darwin → NE Asia / SE Asia | LNG | Gladstone (QCLNG/GLNG), Darwin (FLNG) | Japan (long-term contracts), Korea, China | Major LNG export lane | LNG carrier (145–180K m³) | 5–15 days |
| NQ Townsville → Asian Smelters | Copper / Zinc / Lead | Townsville (Glencore, Teck, Sun Metals) | Japan, Korea, China smelters | Combined base-metal stream | Handymax / Supramax (35–58K DWT) | 8–18 days |
| NQ Lucinda/Townsville → Asia / ME | Raw Sugar | Lucinda, Townsville (Wilmar, MSF) | Japan, Korea, Middle East, Indonesia | Seasonal volume | Handysize / Supramax | 8–25 days |
| WA Grain Belt → SE Asia / Middle East | Wheat / Barley / Canola | Fremantle, Albany, Geraldton | Indonesia, SE Asia, Middle East | ~20M t/yr | Handymax / Panamax | 10–25 days |
| All Major Ports → Asia (Container) | Mixed containerised exports | Melbourne, Sydney, Brisbane, Fremantle | China, SE Asia, Japan, Korea | ~3M TEU/yr | Container 8–18K TEU | 8–21 days |
| Townsville → Pacific Islands | General cargo / containers | Townsville (Sofrana, Swire, PIL) | Fiji, PNG, Vanuatu, Solomon Is., NC | ~15K TEU/yr | MPP / Feeder (2–5K DWT) | 3–10 days |
Strategic NQ Supply Chain Intelligence
| Theme | Intelligence Item | NQ Impact | Time Horizon | Action Required |
|---|---|---|---|---|
| Infrastructure | Townsville Eastern Access Road Corridor (TEARC) — planned port access upgrade linking container berths (3, 4, 10) to highway network | Reduces port congestion; improves container dwell time; lower transport cost | 2025–2028 | Monitor POTL / TMR announcements; plan logistics around construction disruption |
| Mining Sector | Glencore Townsville copper refinery transition to 100% third-party concentrates post-Mt Isa mine closure (July 2025) | New concentrate supply chains from NW QLD, NT, and interstate mines. Aurizon rail utilisation patterns changing. | Now — ongoing | If supplying concentrates: engage Glencore logistics directly. If freight forwarder: update rail booking schedules. |
| Defence / AUKUS | AUKUS nuclear submarine programme — increased US/UK defence logistics through Australian ports; potential Townsville RAAF/military freight uplift | Increased project cargo, defence logistics through Townsville port and Garbutt RAAF base | 2026–2032 | Defence logistics operators: register with Defence Industry Security Program (DISP). ISPS compliance essential. |
| Energy Transition | Copper and battery minerals demand surge driven by global electrification — NQ copper/zinc/lead exports structurally positive for next decade | Strong long-term throughput growth forecast for Berths 2/3. New concentrate sources expected to offset Mt Isa closure. | 2025–2035 | Port infrastructure investment justified. Rail capacity (Aurizon) is the binding constraint — monitor rail investment news. |
| Agriculture | North Queensland sugar sector consolidation — Wilmar, MSF, and Sucrogen rationalising crushing capacity; throughput volumes may shift between ports | Lucinda terminal throughput may fluctuate. Townsville Berth 4 QSCT operations could increase if regional mills shift logistics. | 2025–2027 | Sugar traders: monitor Wilmar QLD logistics announcements. Shipping agents: watch Berth 4 booking patterns. |
| Trade Policy | Australia–India ECTA deepening negotiations — full FTA with India (population 1.4B; growing manufacturing sector) would open significant new trade lanes through NQ | Potential new India container service through Townsville; mining equipment exports to India; beef/live export opportunity | 2026–2028 (full FTA) | Customs brokers: familiarise with ECTA rules of origin. Freight forwarders: monitor new India service announcements. |
| Climate & Resilience | Increasing cyclone intensity (category 4–5 frequency) in NQ waters — Lloyd's of London and Australian P&I clubs increasing premium loading for NQ port operations (Nov–Apr) | Higher insurance premiums for NQ shipments in cyclone season. Port closure disruption risk increasing. Demurrage exposure Nov–Apr structurally higher. | Now — ongoing | All NQ operators: review marine cargo insurance policy before November. Request cyclone cover explicitly. Build extra buffer days in free time planning for Nov–Apr shipments. |
Port of Townsville — Official Shipping Charges Schedule 2025–2026
Effective 1 July 2025. All rates ex-GST unless noted. This is the only publicly available consolidated tariff schedule for the Port of Townsville — a unique resource for shipping agents, freight forwarders, and logistics operators in NQ.
| Vessel Type | Rate Basis | Ex GST | Inc GST |
|---|---|---|---|
| All cargo vessels | GRT × Hours | $0.02781/GRT/hr | $0.03059/GRT/hr |
| Cruise vessels (>1,000 GRT) | Per 12-hour period | $12,885.54 | $14,174.09 |
| Container Type | Unit | Ex GST | Inc GST |
|---|---|---|---|
| Full TEU (20ft) | /TEU | $129.50 | $142.45 |
| Full FEU (40ft) | /FEU | $259.00 | $284.90 |
| Empty TEU | /TEU | $20.11 | $22.12 |
| Flat Rack / Open Top | /TEU equivalent | $4.94 | $5.43 |
| Container Type | Unit | Ex GST | Inc GST |
|---|---|---|---|
| Full TEU (20ft) | /TEU | $100.69 | $110.76 |
| Full FEU (40ft) | /FEU | $201.38 | $221.52 |
| Empty TEU | /TEU | $20.11 | $22.12 |
| Flat Rack / Open Top | /TEU equivalent | $4.94 | $5.43 |
| Cargo Type | Unit | Ex GST | Inc GST |
|---|---|---|---|
| Dry Bulk | /t | $6.19 | $6.81 |
| Oil / Petroleum (liquid bulk) | /t | $8.89 | $9.78 |
| Wet Bulk | /t | $6.19 | $6.81 |
| Vehicles <10 tonnes | /vehicle | $17.12 | $18.83 |
| Vehicles ≥10 tonnes | /t | $7.49 | $8.24 |
| Heavy Lift | /t | $7.49 | $8.24 |
| Tyres | /t | $12.86 | $14.15 |
| Other / General cargo | /t | $7.49 | $8.24 |
| Cargo Type | Unit | Ex GST | Inc GST |
|---|---|---|---|
| Dry Bulk (Townsville berths) | /t | $5.06 | $5.57 |
| Sugar — Lucinda terminal | /t | $1.13 | $1.24 |
| Oil / Petroleum | /t | $6.06 | $6.67 |
| Wet Bulk | /t | $5.06 | $5.57 |
| Livestock (cattle) — live export | /head | $3.14 | $3.45 |
| Refined Metals (copper anode etc.) | /t | $6.26 | $6.89 |
| Vehicles <10 tonnes | /vehicle | $15.89 | $17.48 |
| Vehicles ≥10 tonnes | /t | $6.26 | $6.89 |
| Heavy Lift | /t | $6.26 | $6.89 |
| Period | Ex GST /hr | Inc GST /hr | 4hr Minimum (inc GST) |
|---|---|---|---|
| Day (Mon–Fri standard hours) | $58.24 | $64.06 | $256.26 |
| Night | $64.67 | $71.14 | $284.56 |
| Saturday | $71.13 | $78.24 | $312.96 |
| Sunday | $84.15 | $92.57 | $370.28 |
| Public Holiday | $90.56 | $99.62 | $398.48 |
| Service | Ex GST /hr | Inc GST /hr | 4hr Minimum (inc GST) |
|---|---|---|---|
| Picket boat + 2 officers | $598.78 | $658.66 | $2,634.63 |
| Service | Rate Basis | Ex GST | Notes |
|---|---|---|---|
| Mobile crane (70t) | /hr | On application | Berth 9 heavy lift; pre-booking required |
| Weighbridge certification | /weighing | $28.50 | CoR compliance; VGM / SOLAS |
| Pilotage (MSQ) — vessels >35m | Vessel LOA × distance | Refer MSQ schedule | Compulsory pilotage — all commercial vessels |
| Towage (Smit Lamnalco) | Per movement | On application | Exclusive operator — Townsville port |
Sugar export wharfage at Lucinda ($1.13/t) is one of the lowest bulk rates in Australia — a deliberate competitiveness measure supporting NQ's sugar industry. Compare to copper/refined metals export at $6.26/t, reflecting the higher port service requirement for mineral concentrate handling.
Weekly Logistics Pulse — Week of 17 August 2026
North Queensland Weekly Logistics Pulse
Port updates · commodity alerts · shipping intelligence · regulatory changes. Published every Monday. No spam. Unsubscribe anytime.
Monthly Business Intelligence Report — July 2026 edition
Trade & Logistics Education — NQ Reference Section
About Javier Inostroza

Javier Inostroza
I'm an Industrial Engineer (Universidad Adolfo Ibáñez, Chile) with 4+ years improving operations across port and shipping environments — including standardising port-call and budgeting operations across a 17-port network and a USD 6M business unit, and lifting vessel turnaround by 15% as a Key Account Manager at a container terminal in Chile. My Engineers Australia skills assessment (ANZSCO 233511) is in progress.
The North Queensland Trade Review is that expertise applied in the open: a working record of how I read a supply chain — decompose the system, verify every figure against a primary source, and turn complexity into something a decision-maker can act on. Every map, dashboard and report here is real analysis, built solo, published free.
I'm based in Townsville and committed to North Queensland long-term. I currently hold full, unrestricted work rights on a temporary visa, and I'm seeking a full-time industrial engineering role in the region's port, mining or agricultural logistics sector that can support permanent residency — through a Designated Area Migration Agreement (DAMA) or skilled regional visa (491/190) sponsorship. Open to advisory work in the meantime.
Published Engineering Analysis
Where the method is easiest to see: a self-contained operations-research piece, modelled, validated and published in full.
The Queue at the Gate
An M/M/c queueing model of a truck gate, built from first principles and then checked against a 200,000-arrival simulation. It shows why waiting time creeps and then explodes past roughly 85% utilisation, why merging two queues into one cuts the average wait by more than half on the same lanes, and why appointment-style arrival smoothing buys capacity that would otherwise cost concrete. Parameters are stated and illustrative; the piece is explicit that it models behaviour rather than reporting any terminal’s operational data.
Anchor Briefs — How I Read the Organisations at the Centre of the Network
Three short systems reads of the North Queensland organisations the freight network turns on — Port of Townsville, Aurizon and Townsville City Council — plus a proof-of-work hub that ties them to the free Flow Toolkit. Confirmed figures only; qualitative where no primary source exists.
Engineering Case Studies — Building FlowManager QLD
FlowManager QLD is itself the engineering work. These are three real problems I diagnosed and solved building it — each one systems analysis, design, implementation and validation, not just content production.
Building a Fact-Verification System
Problem: the site was publishing figures faster than it could guarantee they were correct — an audit found one local asset's capacity overstated by more than double, plus outdated and internally contradictory figures across the site. For a publication whose value is authority, a single wrong number is a credibility failure, not a typo.
Approach: treated it as a systems problem, not a content problem. Designed a two-table relational verification gate (a master fact store plus an audit log) so every published number must resolve to a source-and-date record before it can appear — with a hard rule that unverifiable figures are removed or replaced with qualitative language, never hedged and published anyway.
Result: the site moved from zero traceable facts to dozens of verified claims with a standing quarterly re-verification cadence; the most dangerous figure on the site was corrected before any industry expert saw it.
Redesigning for Clarity, Not Just Content
Problem: the interface presented 18 navigation choices before a visitor saw any content, and the site's most distinctive asset — an interactive map of the North Queensland trade corridor — was buried behind a secondary tab.
Approach: collapsed the navigation to a single rail and promoted the corridor map to the primary view. Rebuilt the map itself as a data-driven node graph (entities with coordinates in a structured table) instead of a static illustration, so it's an asset that can grow rather than a picture that goes stale.
Result: navigation cut from 18 pre-content choices to one; a 50+ node stakeholder map shipped as a queryable, extendable asset instead of a fixed graphic.
Closing a Security Exposure
Problem: a full portfolio and database audit surfaced a live API credential hardcoded in the public page source — anyone viewing the page could have read the entire underlying database.
Approach: treated it as a stop-the-line defect and neutralised the exposed credential immediately, accepting a temporary loss of a live data feature in exchange for closing the exposure the same day — then documented the correct long-term architecture (a server-side proxy, never a client-side secret) so the capability gets restored safely rather than expediently.
Result: exposure closed same-day with a dated backup retained; the full database audited and health-rated table by table; the no-client-side-secrets rule written into the project's standing governance so it can't quietly regress.
Supply Chain News Hub — Primary Sources by Node